Applies To:
SharePoint Online and SharePoint On-Premises
Description
This article describes the process of configuring NITRO Reports data using JavaScript in the configuration. Below are some use cases that require script in NITRO Reports
- How to put currency symbol in Report for currency column values in Table report.
- How to scale the actual values in Millions or hundreds to avoid getting zeroes in Report
- Overall Aging report
- Make legend selection one at a time
- How to display bar values on the top of bar in the NITRO Reports?
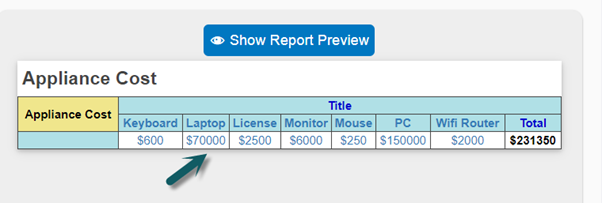
Use Case 1: How to put currency symbol in Report for currency column values in Table report.
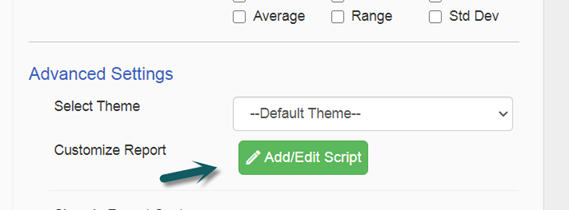
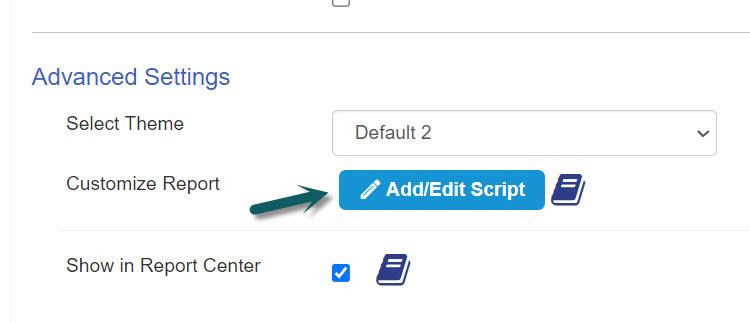
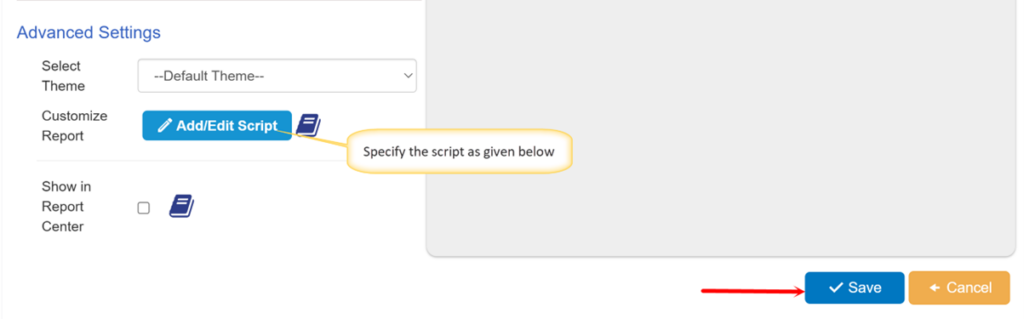
Go to NITRO Report configured for the list –> Advanced settings –> Customize Report –> Add/Edit Script –> set the below script.
Script used below:
var scriptManager = {};//Modify the chart properties. This is applicable for updating Charts like bar, column etc.scriptManager.PreRenderCharts = function(objKendoChart, functionCallback){ //Modify objKendoChart properties. functionCallback(objKendoChart);};//Render table report values. Val is the actual cell value in the below script. We need to configure JavaScript to set updated value depending on the requirement. In this case, we are setting the currency symbol $ before the cell value.scriptManager.tableValueRender = function(val){ return "$"+val;};//Render table report Total X-axis valuesscriptManager.tableTotalXRender = function(val){ return "$"+val;};//Render table report Total Y-axis valuesscriptManager.tableTotalYRender = function(val){ return "$"+val;};return scriptManager;
Sample Report:
Use Case 2: How to scale the actual values in Millions or hundreds to avoid getting zeroes in Report
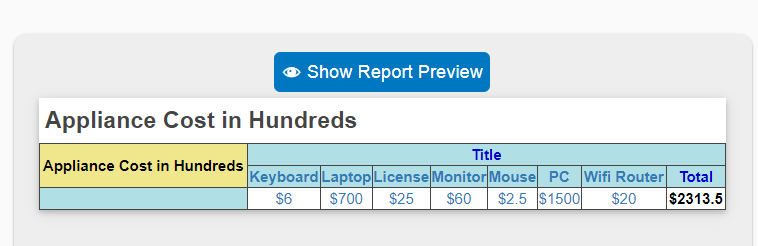
Script below is referring to reduce the actual value divided by 100 in this use case.
scriptManager.tableValueRender = function(val){if(val === 0 || (val && !isNaN(val))){ return "$" + ((Number(val))/100); } return "$"+val;};
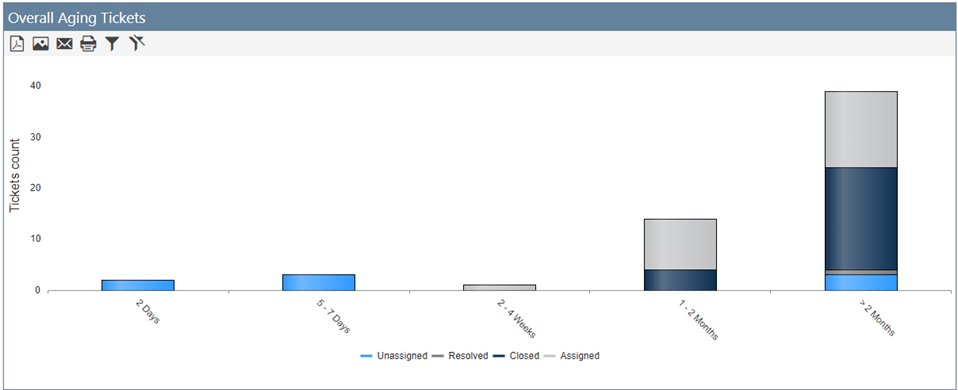
Use case 3: Overall Aging report
If you need this report in List Rollup, then refer to How To Customize NITRO Reports Using Script in List Rollup – Crow Canyon Software Support
Age of an item refers to the difference between a date column value in the item and the current date. In this report, we want to see the number of items for different age values.
In this report, age value is on X axis and Tickets count is on Y axis. “Age” is a single line of text column in ‘Tickets’ list. Age will be calculated dynamically based on the ‘Created’ date of the Ticket when rendering the report using custom script.
Sample output:
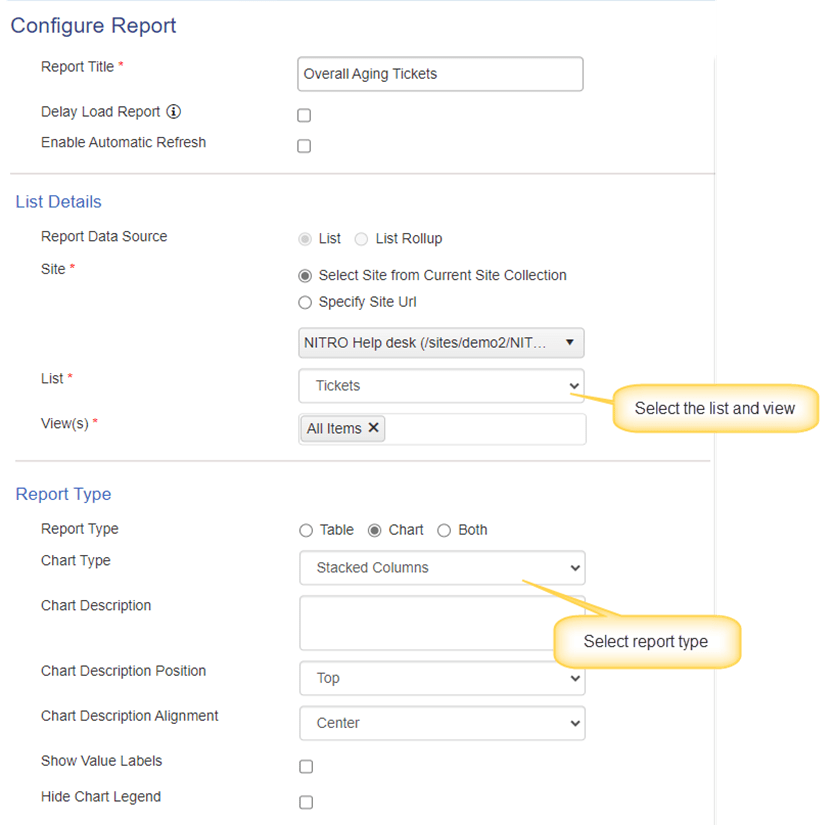
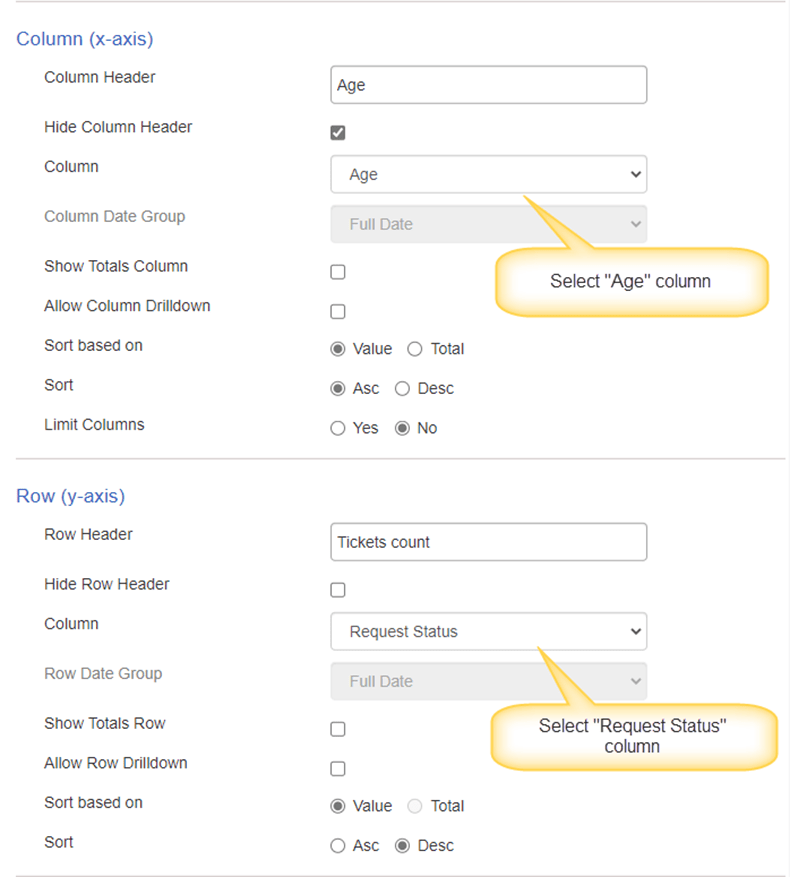
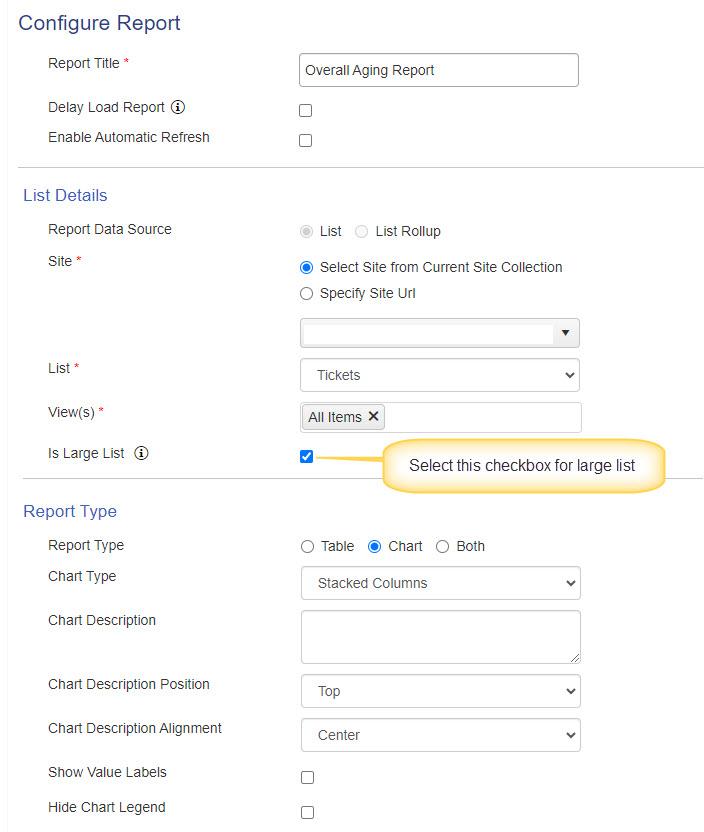
Report Configuration:
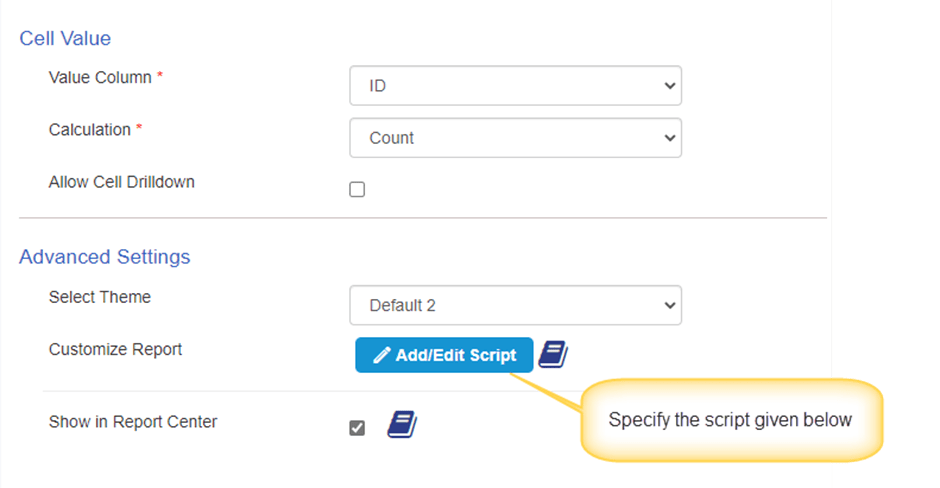
Script used in above:
var scriptManager = {};
scriptManager.UpdateListItemsValues = function(listItems){
              var itemsTotalCount = listItems.get_count();
            for (var i = 0; i < itemsTotalCount; i++) {
                var itemCreated = listItems.getItemAtIndex(i).get_item("Created");
                var todayNewDate = new Date();
                const diffTime = Math.abs(todayNewDate - itemCreated);
                const diffDays = Math.ceil(diffTime / (1000 * 60 * 60 * 24));
                var ageFieldName = "Age";
                if (diffDays <= 0) {
                    listItems.getItemAtIndex(i).set_item(ageFieldName, "Same Day");
                } else if (diffDays <= 2) {
                    listItems.getItemAtIndex(i).set_item(ageFieldName, "2 Days");
                } else if (diffDays <= 5) {
                   listItems.getItemAtIndex(i).set_item(ageFieldName, "2 - 5 Days");
                } else if (diffDays <= 7) {
                   listItems.getItemAtIndex(i).set_item(ageFieldName, "5 - 7 Days");
                } else if (diffDays <= 14) {
                  listItems.getItemAtIndex(i).set_item(ageFieldName, "1 - 2 Weeks");
                } else if (diffDays <= 28) {
                  listItems.getItemAtIndex(i).set_item(ageFieldName, "2 - 4 Weeks");
                } else if (diffDays <= 60) {
                 listItems.getItemAtIndex(i).set_item(ageFieldName, "1 - 2 Months");
                } else {
                   listItems.getItemAtIndex(i).set_item(ageFieldName, "> 2 Months");
                }
            }

	return listItems;
};

scriptManager.GetColumnsToFetch = function(loadingFieds){
	var loadFieldNames = ["Created"];
  return loadFieldNames;
};

//Modify the chart properties.
scriptManager.PreRenderCharts = function(objKendoChart, functionCallback){
	//Modify objKendoChart properties.

	functionCallback(objKendoChart);
};


//Render table report values
scriptManager.tableValueRender = function(val){
	return val;
};


//Render table report Total X-axis values
scriptManager.tableTotalXRender = function(val){
	return val;
};

//Render table report Total Y-axis values
scriptManager.tableTotalYRender = function(val){
	return val;
};

//Sort chart values
scriptManager.sortChartData = function(data){
  debugger;


if (data && data.length > 0) {
    var OrderdCategories =
        ["Same Day",
        "2 Days",
        "2 - 5 Days",
        "5 - 7 Days",
        "1 - 2 Weeks",
        "2 - 4 Weeks",
        "1 - 2 Months",
        "> 2 Months"];

    for (var i = 0; i < data.length; i++) {
        var objItem = data[i];
        var arrayCategories = [];
        var arrayYValues = [];
        for (var j = 0; j < OrderdCategories.length; j++) {
            if (objItem.categories && objItem.categories.indexOf(OrderdCategories[j]) > -1) {
                arrayCategories.push(OrderdCategories[j]);
                var indexYValue = objItem.categories.indexOf(OrderdCategories[j]);
                arrayYValues.push(objItem.yvalues[indexYValue]);
            }
        }
        data[i].categories = arrayCategories;
        data[i].yvalues = arrayYValues;
    }
}
	return data;
};

return scriptManager;
Script details:
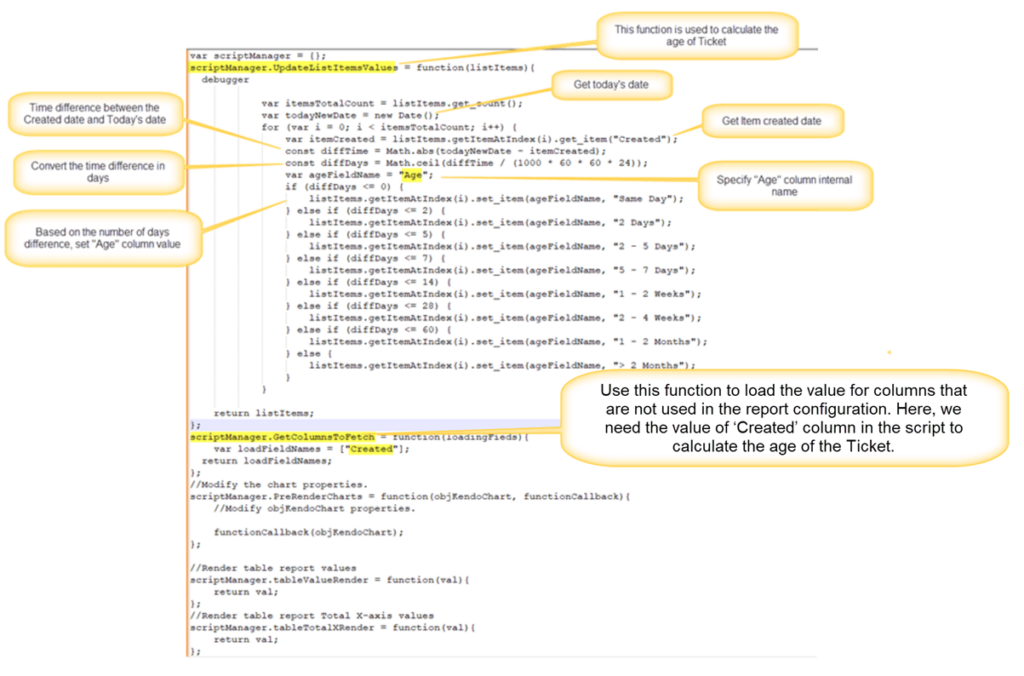
scriptManager.GetColumnsToFetch:
Use this function to load the columns that are not used in the report configuration but are required in the script for custom functionality.
In this report, “Created” column value is required to calculate the text value for age of the Ticket. However, “Created” column is not used in report configuration so its value will not get loaded (it is not used in the report X and Y axis settings). It is required in the script function “scriptManager.UpdateListItemsValues” to calculate the age of Ticket and hence it is added to code in GetColumnsToFetch function.
We can load the additional columns as required if we want to use these columns in “scriptManager.UpdateListItemsValues”.
scriptManager.UpdateListItemsValues:
This function is used to calculate the “Age” of Ticket.
Note: This will not update the column value in the Ticket list item, it only uses this dynamically calculated value for the report.
- This function will iterate through each list item that is used in the report generation.
- Calculate the time difference between the created date of the Ticket and current date.
- Convert the time difference into number of days.
- Based on the number of days, assign a text value to the “Age” column that is used in the report.
Use case 3: Overall Aging report (for ‘Large List’)
Report configuration is same as above except is large list will be checked and the custom script.
Script used in report for large lists:
var scriptManager = {};
scriptManager.UpdateListItemsValues = function(listItems){
  var itemsTotalCount = listItems.length;
for (var i = 0; i < itemsTotalCount; i++) {
	var itemCreated = listItems[i]["Created"];
	var todayNewDate = new Date();
	const diffTime = Math.abs(todayNewDate - new Date(itemCreated));
	const diffDays = Math.ceil(diffTime / (1000 * 60 * 60 * 24));
	var ageFieldName = "Age";
	if (diffDays <= 0) {
		listItems[i][ageFieldName] = "Same Day";
	} else if (diffDays <= 2) {
		listItems[i][ageFieldName] = "2 Days";
	} else if (diffDays <= 5) {
		listItems[i][ageFieldName] = "2 - 5 Days";
	} else if (diffDays <= 7) {
		listItems[i][ageFieldName] = "5 - 7 Days";
	} else if (diffDays <= 14) {
		listItems[i][ageFieldName] = "1 - 2 Weeks";
	} else if (diffDays <= 28) {
		listItems[i][ageFieldName] = "2 - 4 Weeks";
	} else if (diffDays <= 60) {
		listItems[i][ageFieldName] = "1 - 2 Months";
	} else {
		listItems[i][ageFieldName] = "> 2 Months";
	}
}

return listItems;
};

scriptManager.GetColumnsToFetch = function(loadingFieds){
	var loadFieldNames = ["Created"];
  return loadFieldNames;
};

//Modify the chart properties.
scriptManager.PreRenderCharts = function(objKendoChart, functionCallback){
	//Modify objKendoChart properties.

	functionCallback(objKendoChart);
};


//Render table report values
scriptManager.tableValueRender = function(val){
	return val;
};


//Render table report Total X-axis values
scriptManager.tableTotalXRender = function(val){
	return val;
};

//Render table report Total Y-axis values
scriptManager.tableTotalYRender = function(val){
	return val;
};

//Sort chart values
scriptManager.sortChartData = function(data){
  debugger;


if (data && data.length > 0) {
    var OrderdCategories =
        ["Same Day",
        "2 Days",
        "2 - 5 Days",
        "5 - 7 Days",
        "1 - 2 Weeks",
        "2 - 4 Weeks",
        "1 - 2 Months",
        "> 2 Months"];

    for (var i = 0; i < data.length; i++) {
        var objItem = data[i];
        var arrayCategories = [];
        var arrayYValues = [];
        for (var j = 0; j < OrderdCategories.length; j++) {
            if (objItem.categories && objItem.categories.indexOf(OrderdCategories[j]) > -1) {
                arrayCategories.push(OrderdCategories[j]);
                var indexYValue = objItem.categories.indexOf(OrderdCategories[j]);
                arrayYValues.push(objItem.yvalues[indexYValue]);
            }
        }
        data[i].categories = arrayCategories;
        data[i].yvalues = arrayYValues;
    }
}
	return data;
};

return scriptManager;
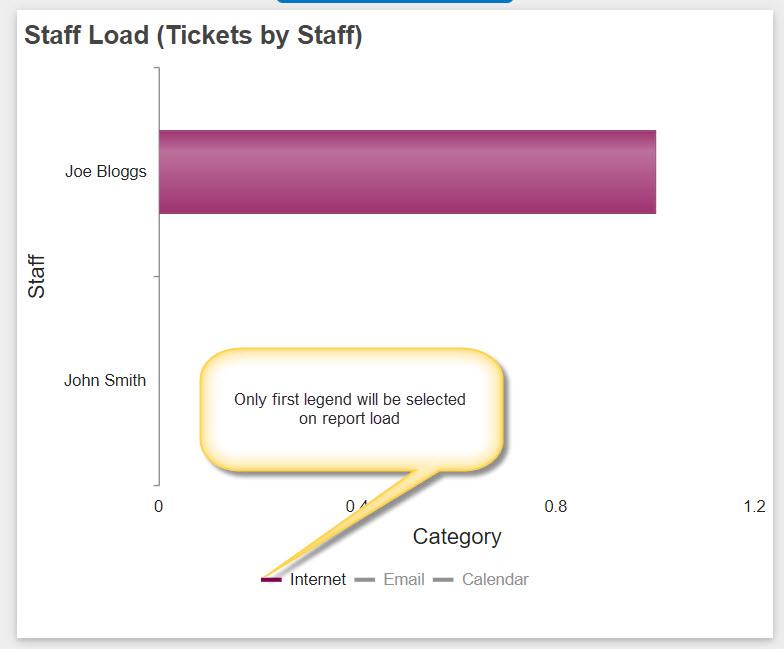
Use Case 4: Make selection of legend one at a time
In this use case, NITRO Report is configured on a list and have multiple legends to show. We will make the first legend active while disabling other legends. Upon selection of each legend, we render the report only specific to the selected legend.
Go to NITRO Report configured for the list –> Advanced Settings –> Customize Report –> Add/Edit Script –> set the below script. Please refer to the script code added in ‘PreRenderCharts’ function from below.
Script used in the report
var scriptManager = {};

//Modify the chart properties.
scriptManager.PreRenderCharts = function(objKendoChart, functionCallback){
	//Modify objKendoChart properties.

    var SetVisibleLegend = function (index, objKChart) {
      var arraySeries = objKChart.series;
      for (var i = 0; i < arraySeries.length; i++) {
          arraySeries[i].visible = index == i;
      }
     // objChart.redraw();
  	};

    SetVisibleLegend(0, objKendoChart);
    objKendoChart.legendItemClick = function (e) {
        e.preventDefault();
        SetVisibleLegend(e.seriesIndex, e.sender.options);
      e.sender.redraw();
    };

  	functionCallback(objKendoChart);

};


//Render table report values
scriptManager.tableValueRender = function(val){
	return val;
};


//Render table report Total X-axis values
scriptManager.tableTotalXRender = function(val){
	return val;
};

//Render table report Total Y-axis values
scriptManager.tableTotalYRender = function(val){
	return val;
};

return scriptManager;
After the report is loaded, we can select each legend at a time so that previous selection will be toggled.
Use Case 5: How to display bar values on the top of bar in the NITRO Reports?
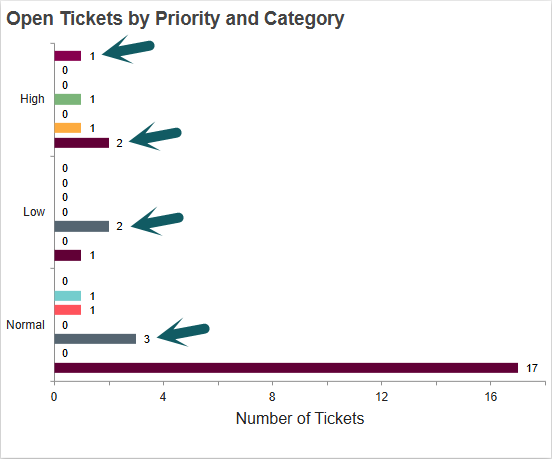
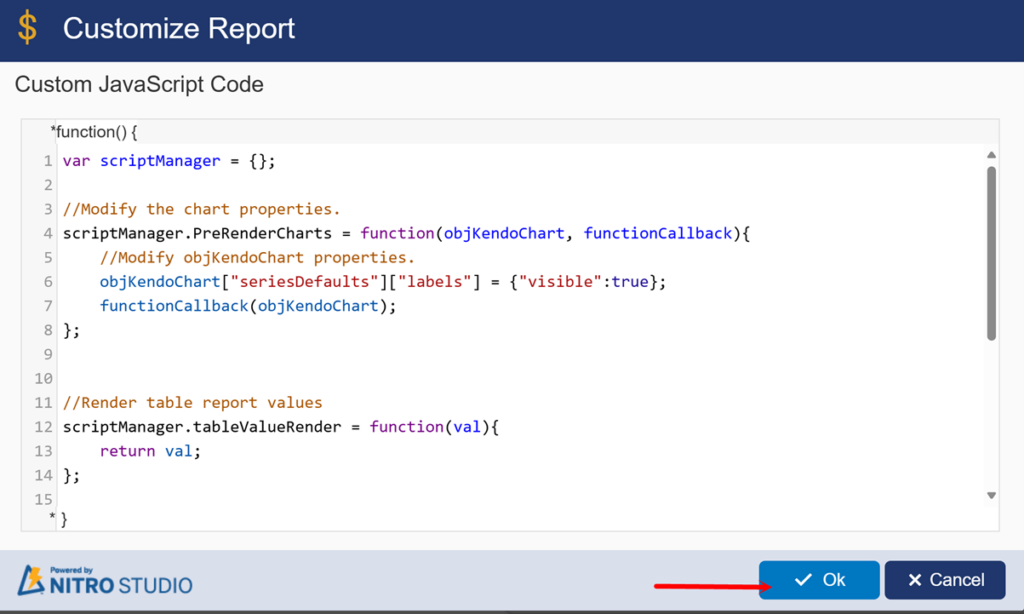
Go to NITRO Report configured for the list -> Advanced settings -> Customize Report -> Click ‘Add/Edit Script’ button -> Specify the below script:
Script:
var scriptManager = {};

//Modify the chart properties.
scriptManager.PreRenderCharts = function(objKendoChart, functionCallback){
	//Modify objKendoChart properties.
	objKendoChart["seriesDefaults"]["labels"] = {"visible":true};
	functionCallback(objKendoChart);
};

return scriptManager;